I forgot I had done this...
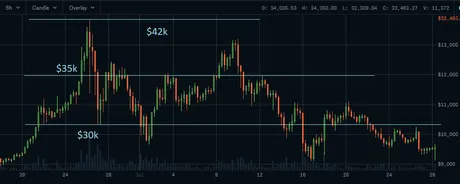
Found this analysis in my files... created this one on January 12th 2021. The plan was the overlay the 2019 bull run fractal over our current run.
So where are we?
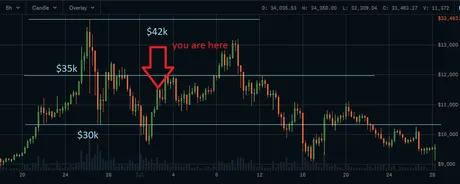
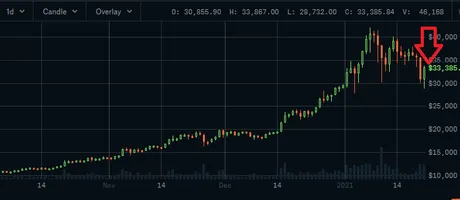
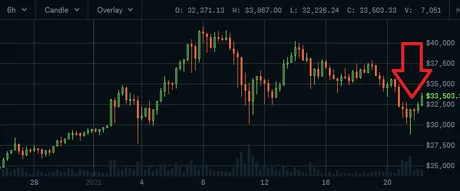
So it's really not so gloom and doom in the short-term if this plays out like we'd hope. It looks like we still haven't hit the "real" cat-cat-bounce yet; I assumed we had already. We've achieved the second lower dip and now we're looking for the bounce... assuming this fractal is accurate.
If it plays out similarly the price should bounce off $35k to $32.5k before it runs up to near or all time highs over the next week. The timeline seems to be playing out twice as fast during this run as 2019. With movements that took 4 days to complete in 2019 are playing out in 2, while 6 day movements are completing in 3.
Conclusion
It's really about what happens in the next week or so. End of January trading will probably provide quite a bit of information. Would be interesting to see if we keep following this pattern.

It is interesting that I chose those blue lines for the overlay ($42k, $35k, $30k) on the 12th of January before the market had bounced or crashed recently. The fractal has held up pretty well so far given the baselines I chose back then.
Chart of Jan 12:
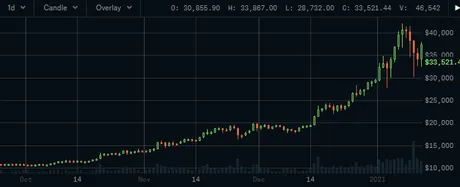
So back when I had made this prediction there really wasn't a lot to go by. Now we've seen another peak and another dump since then, that look strikingly similar. Seems like no matter how this goes down there's going to be some kind of bounce off $35k, in both bullish and bearish scenarios.
Analysis
There now I've predicted the price going up and down.
Can't lose now.
Suckers.
Is this the hopium you were looking for?
Return from 2019 Fractal is Still in Play: Possible ATH in 1 week to edicted's Web3 Blog
