
My last post was supposed to be this post...
But then I just kept ranting about other stuff and it never happened. Not the first time. Won't be the last.
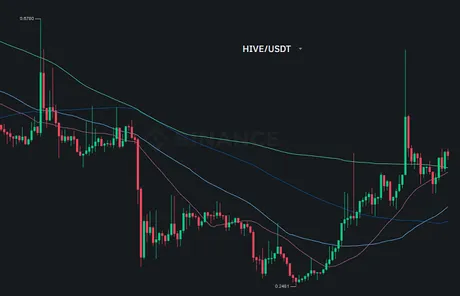
Hive MA()
I noticed yesterday that Hive is on the brink of confirmation for a massive years-long reversal. The 25 day Moving Average MA(25) and the 200 day Moving Average MA(200) are essentially guaranteed to Golden Cross basically tomorrow or the next day. I didn't realize just how big of a deal this was until I asked the question, "Wen is the last time this happened?" The answer was nothing other than sheer unadulterated hopium and FOMO bullishness.
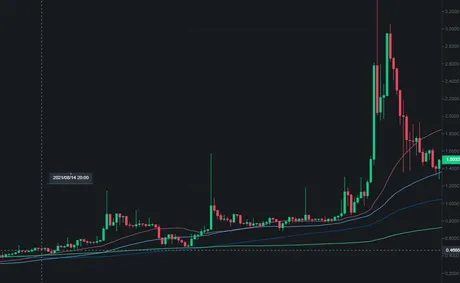
I scrolled and scrolled and scrolled.
Until I finally got back to August 14th, 2021. Wow... price of Hive at the time was around 46 cents. Say, what's the price of Hive right now? You might say it's right around 46 cents. Pretty weird, right?
I mean look what happened after this Golden Cross occurred.
You probably already remember... I know I do.
I was sitting at the Thanksgiving family dinner table showing everyone my Hive account that was worth half a million dollars while saying,
"lol, I'm so fucked it's all locked I can't cash out I'm going to lose most of this."
And then I proceeded to do just that.
Held most of my Hive all the way down, although I did sell a chonk at $1.40 (or whatever it was) after the SPK/Ragnarok double airdrop on Jan 6, 2022. Looking at the chart that's probably exactly what I sold it for.
If I had any sense whatsoever I would have realized long ago that the 20% yields on HBD were the best possible deal ever in the entire cryptosphere. Greed makes us blind to these things during the bull. Could have easily locked in $60k HBD and been earning $1000 a month yields this entire time... all in a stable coin. Live and learn.
It's pretty obvious that I do not take technical analysis very seriously at all. I'm not good at it, and I don't care. I like to draw lines and speculate. It's a 'fun' hobby that's very akin to window shopping. Very rarely do I actually place any bets based on the conclusions I come to. That may change going forward as I attempt to better acclimate to this idea of doing what Hive wants me to do rather than trying to make money for myself. It's better to provide value to the network than it is to attempt extracting value from it. I've learned this the hard way on multiple occasions.
When I post Hive charts many will notice that tracking four different moving averages makes everything look very busy and not super easy to read. Personally I'm getting used to it but I can imagine other people looking at it and being like "why?". So I figured in this post I'd lay out the patterns I've seen across all four of these lines over the last few years.
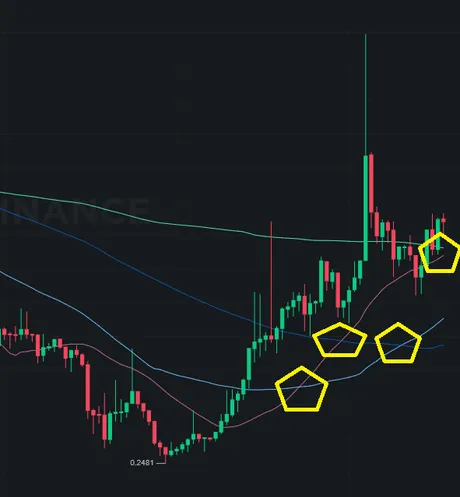
After bottoming out at 25 cents we had a lot of Golden Crosses come in as is often the case, simply due to the math of it all. It's important to note that the default moving averages shown across multiple exchanges are often quite similar. These default lines tend to have much more immediate effect than the custom lines that I have chosen.
Two main default Moving Averages:
-
MA(25) - The 25 day moving average is the standard on Binance and, in my opinion, one of the best moving averages to look at on the short-term basis. Anything less than around four weeks simply isn't enough time for the average to have any meaning.
-
The MA(7) is also a default on Binance but I have found it to be completely worthless in every way. MA(7) might be useful for fast paced hardcore day trading and leveraged positions on 1 minute or 5 minute candles, but I'm not that big a degen so it's worthless for my personal uses.
-
MA(99) - Technically 99 days is the longer-term MA on Binance, but I rounded it up to 100 for personal use because... well probably because of unit bias and round numbers. Luckily they are both essentially the same line.
With this in mind as a frame of reference it should be no surprise that golden/death crosses between the MA(25) and the MA(100) have huge and immediate significance to the price of Hive. Because so many more people are looking at these averages by default there tends to be a lot more price action around them in the short term.
This was confirmed just recently with the golden cross between the MA(25) and the MA(100) on January 30th. Immediately after that happened it was just up up up up up for five days in a row until the blow-off top finally capped out around 60 cents and a +50% gain later.
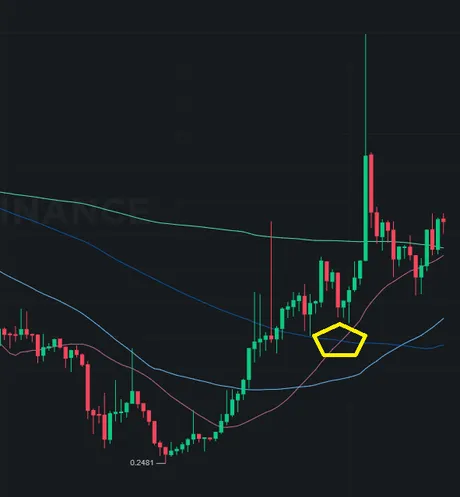
Meanwhile, we can see that the golden crosses involving the MA(50) were more like the opposite. The price would dump right after the golden cross and then pump out of that position later. Looking back at the history of Hive it looks like this actually happens quite often, with crosses involving the non-standard MA(50) resulting in weird inverse price action, especially on the short term.
MA(200)
This line is also custom but it is my favorite one because the movements are so smooth and predictable. After all it's tracking more than half a year of data and aggregating it all into a single price point. The MA(200) has acted as a massive resistance during this entire bear market. There were many many pumps to and above this line, and selling whenever that happened over the last year would have landed you some quite nice gains. However, the trend reversal seems to be kicking in, and this line very well may flip support over the next 12 months to come. In fact I am counting on just that.
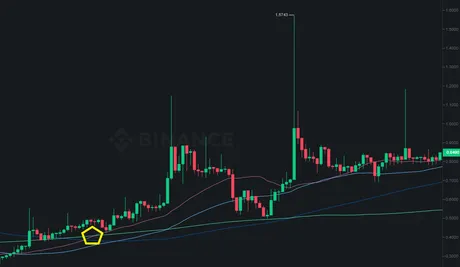
Looking back to our last 25/200 golden cross on August 14, 2021 we can see that it was not immediately bullish and more signaled a long drawn out pump & dump that lasted three months before the blow off top. What a coincidence that I've also been saying that if Bitcoin gives us a repeat of 2019 on the 4-year cycle we should blow-off top in about 3 months (May/June). I'm leaning toward May because this one seems to have kicked off slightly earlier than 2019, so I figure it very well could end earlier too. 3 months momentum is a classic amount of time for crypto bubbles that we can find many examples for.
In the above chart we see the golden cross actually resulted in a very short-term dump followed by a big x2 pump over $1, back into a dip to 50 cents into another even bigger pump around $1.50. Every time it pumped out of control it blew the moving averages out of the water and we were flying high, and every time we knew we probably should have sold a bit, but didn't.
When to buy back in?
When the price pumps and leaves everything in the dust, the highest support line is going to be the MA(25) with the lowest one being the slower moving MA(200). We see the dump after the first pump broke below MA(25) and all the way down to the MA(200) green line. However, the second even bigger pump was able to get support from the MA(25) as it mostly traveled on that line the entire time in the wake. We can also see that one time bears tried to dump it below MA(50) but it immediately got bought back up by the bulls.
And then... the motherlode...
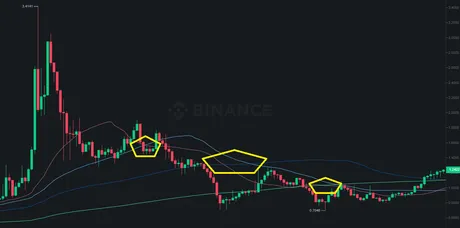
After Hive pumped to $3.40 everyone was losing their minds and hoping for another pump to $10 or more. Especially true considering many thought Bitcoin would hit at least $100k or even $250k. However, our fate was sealed. We flew too close to the sun, and it was time to crash and burn.
We can see that the first dump caught some support on the light blue MA(50), but as soon as the MA(25) death-crossed below it this pretty much signaled the beginning of the end. After that the price hugged the MA(100) for about a week... I remember that time... hoping that support would hold... it... didn't :D
By the time 3AC and UST were imploding we cratered all the way below the MA(200)... then we experienced a lot of chop and confusion after that, no one really knowing what to do. In retrospect selling at 80 cents could have been a great play, but at the time if you can recall it seemed really dumb.
"Don't sell the bottom."
"Oops that wasn't the bottom." "It is what it is."
Full Capitulation
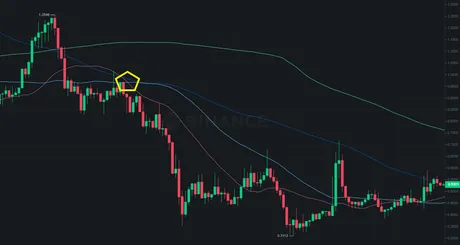
And right when it seemed like it was all good and we were about to make a swift recovery... BAM! FTX collapses and everyone is completely fucked. I had plenty of warning time to react. Just look at that obvious double death-cross between all three of the shorter MAs. I didn't want to believe it. HODL! I yelled... I was dumb... lol. Two weeks later the price crashed 60%! lol wtf! Not cool SBF! Bro!
Distressed seller or buying opportunity?
Looking at all these moving averages and how well they can predict which way the price is going and where we will find support after the pump... I'm actually kind of mad that I didn't trade Hive more over the the last two years. Even if I was only gambling a couple thousand dollars here or there I could have made a mint over time, and the risk that would pose basically rounds to zero when considering my massive powered up position. Again... live and learn.
Conclusion
Obviously I can't guarantee it will happen, but absolutely be ready for a massive rally over the next three months. Bitcoin is signaling it, and Hive is signaling it as well. A repeat of 2019 and the 4-year cycle is definitely in the cards.
Every single time the MA(25) has gone over the MA(200) on Hive we've seen major fireworks of around x10. Of course it's only happened twice because the MA(200) didn't even exist until November 2020. That's how new Hive is. Don't forget that bit.
The hardest thing about trading this market is having steady hands and not getting over-excited. When we make a financial decision we usually overthink it and tend to overinvest in this new position. Try to stop yourself from doing this and simply make smaller trades over longer periods of time (DCA). I say "simple" but it is actually one of the hardest thing to do in crypto. It might be simple but it is definitely not easy. Such is crypto.
Return from Analyzing Hive's Moving Averages to edicted's Web3 Blog
