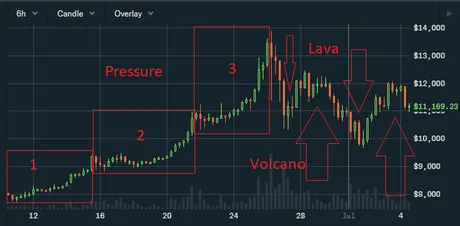
This post is an update to The Volcano.

This is what the market looked like 3 days ago.

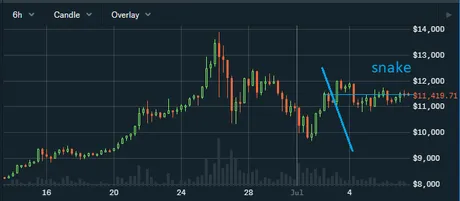
This is what the market looks like now.
I sold at $11.2k, so I'm still slightly in the red on my trade. However, it looks like the market has broken the Volcano pattern and has now moved into the snake pattern. The up and downward movements are stabilizing around 11.4k to 11.2k.
I've seen this pattern many times. Normally, right when the currency becomes incredibly stable, it breaks out and makes a big movement in a certain direction. Our support line is currently parabolic, so I think there is a much better chance of it crashing soon rather than spiking up... however, if it does spike up and continue parabolic action... it could be a huge spike up... I'll buy back in and take the loss if Bitcoin breaks above 12k. In fact, I might do it even a little sooner than that if the FOMO gets me. No I won't... stupid FOMO.
Bouncy Ball
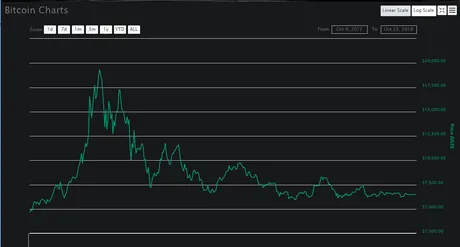
Similar to the Snake is the bouncy ball. We all experienced this during the bear market. Bitcoin kept bouncing off 6k support and then spiking half as high as the previous bounce. The bouncy ball has a support line where the snake has an equilibrium line that the price dips above and below like a Sin-wave.

Many TA guys call these bounces dead-cat bounces, as there is no momentum left. I prefer bouncy-ball. Sue me.
Conclusion
If you guys haven't noticed by now I'm basically just making shit up. I've been doing these half-assed TAs for over a year now and I've been wrong more than I've been right. However, maybe I'm getting better at it! It is the year of the boar after all.
I just thought it would be fun to point out some patterns I've noticed in the market and give them real-world names. You never know, maybe one day I'll actually take this seriously and do a bunch of extra real analysis.
I expect a crash within 3 days.
Return from Bouncy Ball & Snake Patterns to edicted's Web3 Blog
