🌽
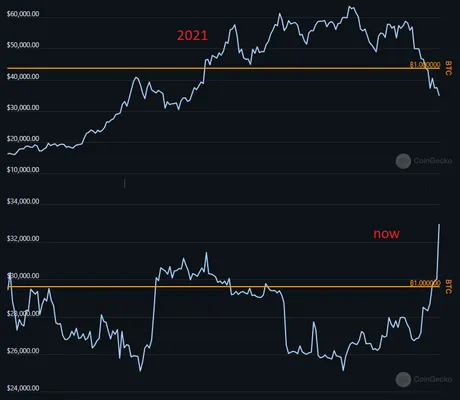
Obviously we got some insane price action yesterday that sent the whole space squealing out of control. I saw a lot of talk about $31k being a resistance, but I seemed to know better than most people. There was zero resistance at $31k. In fact, we spiked from $32k to $35k in under two minutes. A third of a billion dollars in short squeezes later and the entire mindset of the space has shifted. We are no longer in a bear market.
Of course anyone with common sense can easily see that the bear market immediately after the FTX collapse. This is why charts can be deceiving. Those who didn't live through this period of time will look at a chart and not realize that we just lived through the entire year of 2023 thinking it was a bear market, when it was really just the first year of the bull market just like it always is. This is a 4-year cycle, and only one of those years is a bear market (2022). It is known.
 The x-axis (time) is the same length in both SS but the y-axis is a different scale and deceiving.
The pump we got on Feb 7, 2021 is comparable to this one.
Others still look at yesterday's green candle and call it a "god candle" because that's exactly what it is. The contrarian response to this is something like, "Yeah, a god candle for ants," or some such nonsense. Yeah, it's not though. That's one of the biggest daily candles BTC has ever had. People forget that these runs last longer than a day.

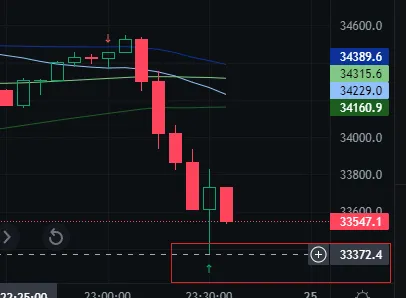
Within an hour of me saying this the market did exactly what I said it would. And I traded it almost perfectly.
 5m candles
Another milestone
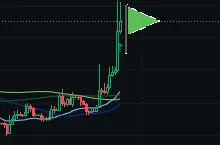
Today was the first day that I've correctly assessed the pattern we are seeing in the market and correctly day-traded it for a profit. This is clearly a bullish flag pattern. Price is highly volatile and slowly coming to a point at the $34k level. After BTC stabilizes at $34k it will spike up again. A bull flag is one of the most bullish patterns possible and also one of the easiest ones to trade.

Basically what is happening here is that bulls want as much BTC as they can get without pushing the price up. The shorts have been annihilated so there's very little reason to keep pushing it up in the short term. The market is waiting for users to dump their BTC. Don't be the sucker that dumps on a bull flag. That's just silly. We haven't seen this pattern since... I want to say 2021 but I can't even find one, so maybe 2017 or even summer 2019. Needless to say it's been a very long time.
So we should continue to expect the price to continue tapering until it stabilizes around $34k. With any luck volume will drop like a brick and bears will be tempted to short the market all over again only to get completely wrecked on the next pump. Again, the market clearly wants more BTC, and there aren't a lot of sellers. Volume was three times higher than this during the summer and the price movements were less than what we are seeing today. This indicates a massive supply shock, which is confirmed by on-chain analysis.
A Twitter story
Yep so that happened.
So what happens now? Well if the bull flag pans out as expected it should be mostly boring for a few days until the price settles around $34k. My guess would be 3-5 days, and coincidentally enough the crystals girls whisper about the next full moon on the 28th of October also being a partial lunar eclipse. You all know how I like to make shit up like "Eclipse bullish" and whatnot.

Sticking to the plan
My plan has always been to hold my position till my 40th birthday on November 14th.
Surly the market revolves around me so this is a sound strategy.
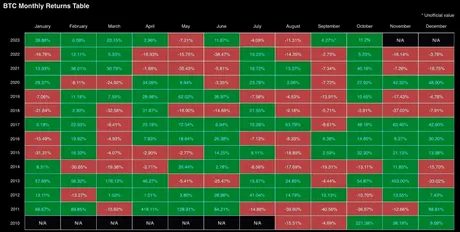
- September was a green month which is very rare and bullish.
- October has changed everyone's outlook even though it's only up 21% so far.
- November is always the crazy ass month given these setups.
What's a good guess for the local top?
A bull market like this is going to go x2-x3 above the baseline.
Normally the stronger the baseline, the higher the peak.
Those who have been paying attention to my tweets know that the current baseline is one of the strongest ones we've ever seen, so an x3 is pretty reasonable. But where is the baseline?
Well it's either at $26.5k which is where we bottomed out right before the current pump, or the much safer and tested level was $25k. That would mean I expect BTC to hit something like $75k before the end of January. There also appears to be a nasty resistance block in the $45k-$50k area so this is also a level to lookout for if you believe that a new all time high this early is a bit ridiculous.
If an ETF gets 100% confirmed by the SEC and Blackrock/Grayscale I think we have to assume that the price could go a helluva lot higher than even these predictions. The market loves to try to price these things in and frontrun any potential fundamental developments like this, which always leads to sell-the-news events were the speculation and overhyped FOMO always trump the launch day of the new thing.
There's also the exponential curve to take into consideration. Both the doubling curve and PlanB's stock-to-flow analysis but BTC at $100k by the end of the year. As ridiculous as that sounds it's really only an x3 from where we are now and easily possible. At the same time this is another reason why the $50k level is significant, as this is not only a huge unit-bias level but also half of the $100k target. This means a lot on the logarithmic scale and exponential growth factors.
Conclusion
The god-candle-flag is pretty much the most bullish and most predictable technical indicator of all trading. It's a bull market dream, and we are seeing one at exactly the correct timeline. None of this is accidental. What happens if the FED decides to start lowering rates in a couple of months?
Even if they don't it becomes a win/win situation because leaving rates high creates systemic risk for the entire legacy system, including assets that were once thought to be safe like treasuries. Just this month Bank of America was forced to report $132B in unrealized losses on their assets. This puts Bitcoin in a win/win situation where it's either a risk-on asset during quantitative easing or a risk-off "flight to quality" in the opposite scenario. Crazy times we're living in.
In any case it's obvious that the current bull market has staying power. Volume is still relatively low, which would be concerning in most cases, but in this one it simply means that the price must go even higher because nobody is selling. Bulls are going to accumulate here for a few days before pushing higher. Another 20% god-candle will push us up to $40k. Best case situation would be transitioning from one bull flag into a second one. Wouldn't be the first time. Fingers crossed.
Return from Bull Flag Materializing to edicted's Web3 Blog
